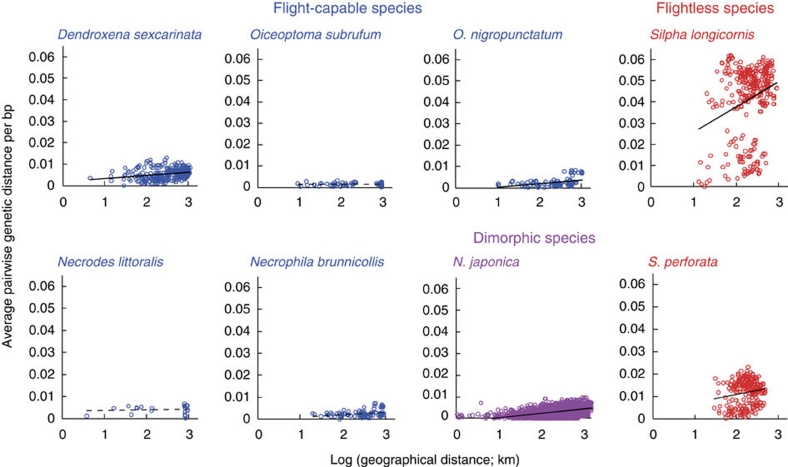
Figure 1. Relationship between geographical and genetic distance in each species.
Genetic distance is the average pairwise distance per base pair of the COI-II gene. Sample size (n), Mantel test (P-value) and slope of regression (b): Dendroxena sexcarinata, n=300, P <0.001, b=0.00062; Oiceoptoma subrufum, n=55, P=0.538, b=–0.00001; O. nigropunctatum, n=105, P=0.014, b=0.00075; Necrodes littoralis, n=21, P=0.197, b=0.00013; Necrophila brunnicollis, n=91, P=0.069, b=0.00049; N. japonica, n=3,655, P<0.001, b=0.00087; Silpha longicornis, n=325, P<0.001, b=0.00513; S. perforata, n=231, P=0.037, b=0.00165.

