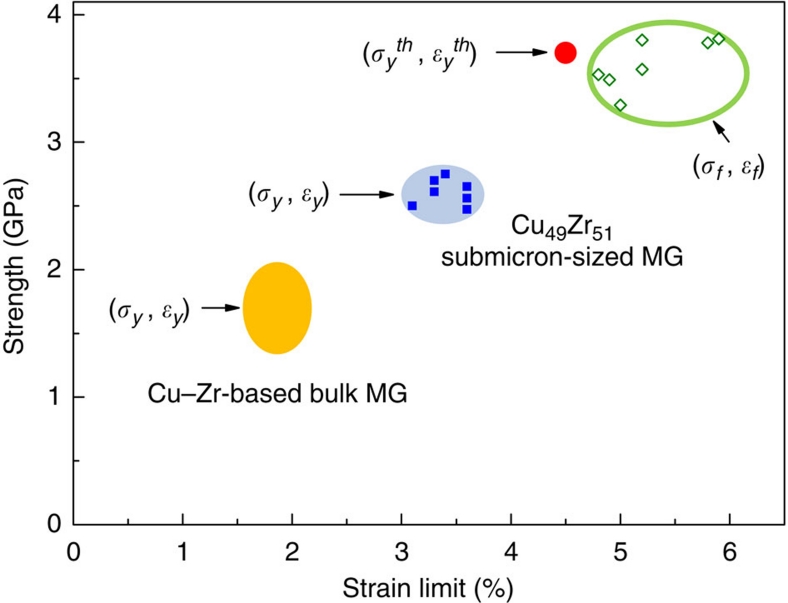
Figure 1. Strength and strain limit of Cu–Zr metallic glasses.
The yellow shaded ellipse area represents the yield stress and yield strain range of Cu–Zr-based bulk samples. All other data are results from our in situ tensile tests of Cu49Zr51 samples with diameters in the range of 200–300 nm. The blue solid squares represent the yield strength (σy) and yield strain (ɛy) at the proportionality limit. The measured fracture strength (σf) and fracture strain (ɛf) are shown with green open diamonds. The theoretical elastic limit (σyth, ɛyth) given by equation (1) is marked by the red solid circle. The ɛf values exceed the theoretical elastic limit due to a small contribution from plastic deformation. When the latter (<1%) is deducted from ɛf, the resulting total elastic strain is consistent with the predicted ideal elastic strain limit.

