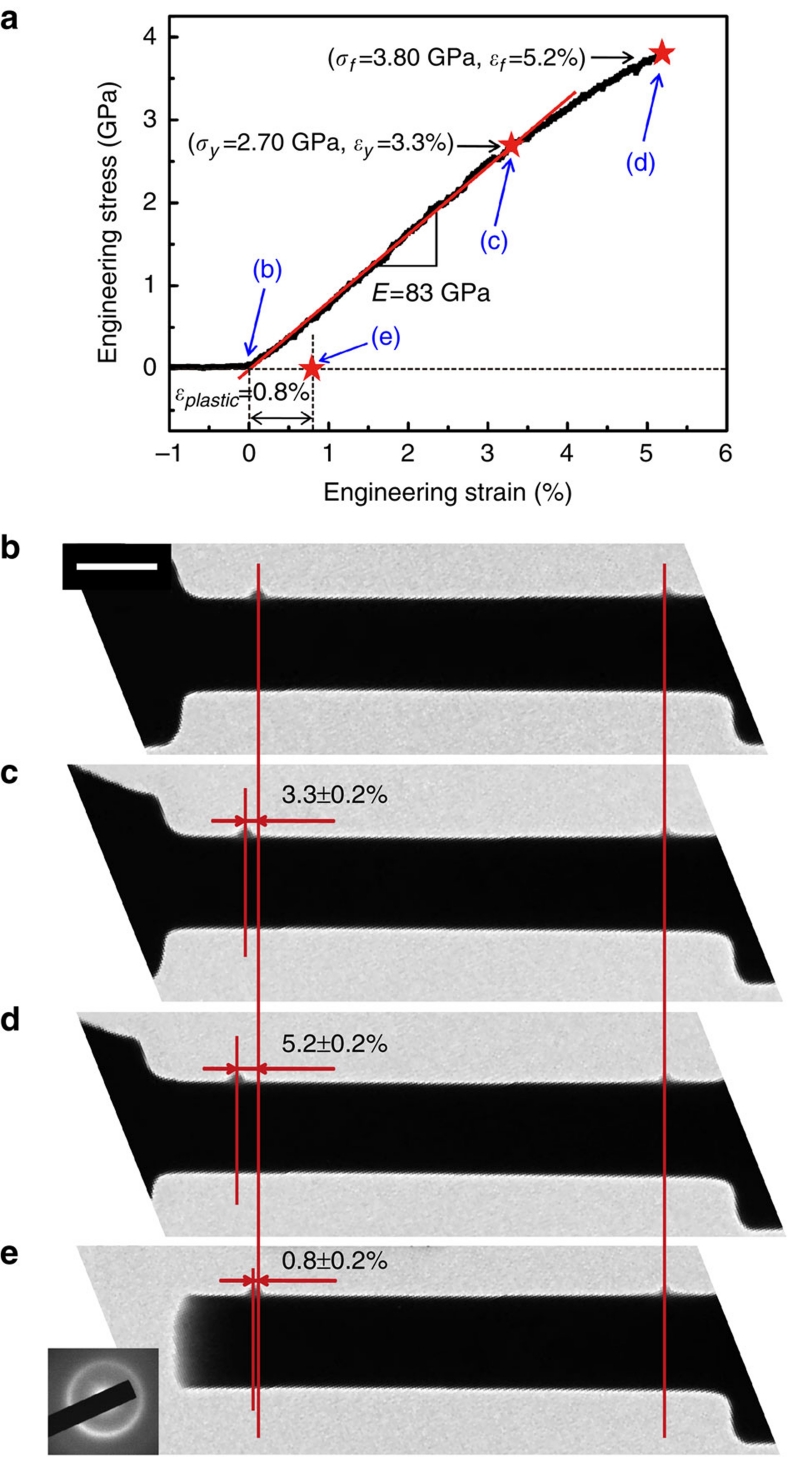
Figure 4. Tensile behaviour and corresponding strain evolution of the d=220 nm sample.
(a) Engineering stress–strain curve from the tension test. The average strain rate was about 2×10⁻³ s−1. Mechanical properties extracted from the stress–strain curve include Young's modulus (E), σy and ɛy (defined at the proportionality limit), fracture strength (σf) and total elongation to failure (ɛf), as well as the plastic strain (ɛplastic) remained in the gauge length. (b–e) These still frames extracted from the recorded movie (see corresponding points in a) demonstrate that the virgin sample (b) was elongated to a strain of ɛy=3.3±0.2% (c) when global yield began, and then fractured upon a total strain of ɛf=5.2±0.2% (d), among which ɛplastic=0.8±0.2% was measured from e, and the rest 4.4±0.2% was the total recoverable elastic strain. These strains were determined with high accuracy because there were no rough/irregular fracture surfaces to re-connect back, as the fracture occurred outside the section between the two markers. No crystallization was observed near the fractured region, as further confirmed by the selected area electron diffraction pattern (inset of e) taken from the fractured area. The scale bar in b represents 200 nm, and the magnification was same for all the TEM images.

