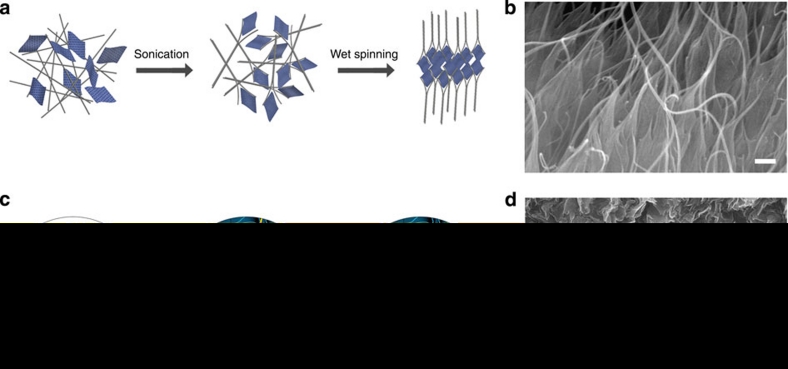
Figure 1. Preparation and structure of polymer composite fibres.
(a) Schematic diagram showing the formation of the oriented interconnected network of RGOFs (curved rectangles) and SWNT bundles (grey lines) as a result of sonication and subsequent wet spinning. (b) SEM image of the cross-sectional area of a RGOF/SWNT/PVA fibre (1:1 weight ratio of RGOF to SWNT), which clearly shows the co-assembly of RGOFs and SWNTs. Scale bar equals 100 μnm. (c) Schematic illustration of structural evolution between coagulation-spun RGOF gel (left), polymer composite (middle) and polymer-free fibres (right). Yellow lines and blue curved rectangles represent PVA chains and RGOFs, respectively. (d) SEM image of the cross-sectional area of a polymer-free RGOF fibre, which clearly shows the wrinkled RGOFs. Scale bar equals 500 nm.

