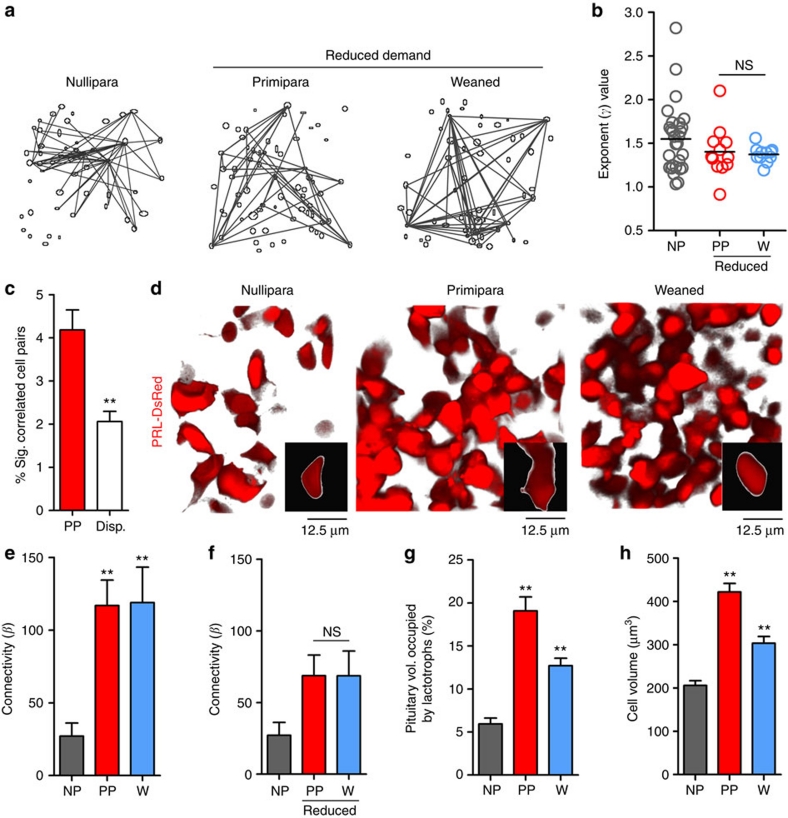
Figure 2. Suckling promotes lactotroph population functional connectivity through changes in structural connectivity.
(a) Functional connectivity does not change in primiparas or weaned dams subjected to lactation with reduced suckling stimulus. (b) Confirming (a) statistically, power-law exponent (γ)-value for primiparas (PP) and weaned (W) dams subjected to reduced demand is similar to that observed in nulliparas (NP; NS, nonsignificant versus NP; Kruskal–Wallis test, n=11–12 from at least three animals). (c) Correlated cell–cell behaviour is impaired in primiparas when tissue structure is disrupted (Disp.; **P<0.01; Mann–Whitney U-test, n=12 from four animals). Values represent mean±s.e.m. (d) Lactotrophs are organized into a three-dimensional network. Structural connectivity is low in nulliparas (left panel), but increases in primiparas (middle panel). Following weaning, connectivity is maintained despite cessation of stimulus (right panel). Insets are typical cell profiles. (e) To directly correlate structural (SC) and functional (FC) connectivity, three-dimensional reconstructions were acquired of the lactotroph network subjected to Ca2+ imaging. Postanalysis of connectivity (β) reveals an increase in SC in primiparas that reflects heightened FC. Postweaning, high levels of SC persist (**P<0.01 versus NP; Kruskal–Wallis test, n=12–14 slices from at least five animals). Values represent mean±s.e.m. (f) As for e, but for primiparas and weaned dams subjected to reduced demand. Note that SC was no different to nulliparas (NS, nonsignificant versus NP; Kruskal–Wallis test, n=9–11 slices from three animals). Values represent mean±s.e.m. (g) Pituitary volume occupied by lactotrophs increases in primiparas versus nulliparas and this persists following weaning (**P<0.01 versus NP; Kruskal–Wallis test, n=15–21 image stacks from three animals). Values represent mean±s.e.m. (h) Lactotroph network density and plasticity are driven by an in situ increase in cell volume as calculated by single-cell rendering of image stacks (**P<0.01 versus NP; Kruskal–Wallis test, n=62 cells from three animals). Values represent mean±s.e.m. Sig. significant.

