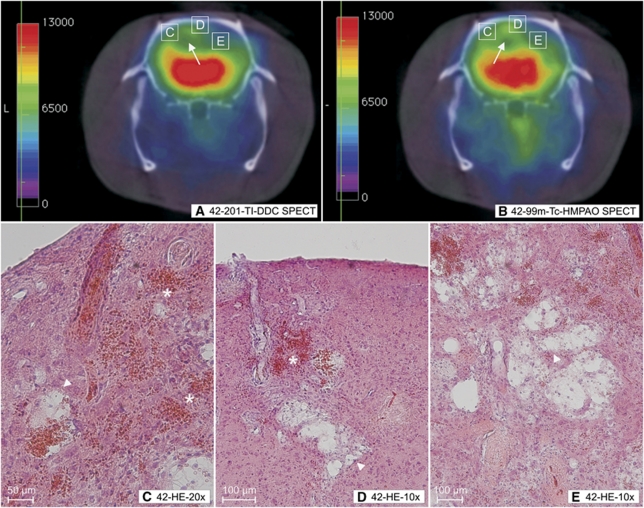
Figure 6.
201-TI-DDC SPECT, 99m-Tc-HMPAO SPECT, and histology performed in the same animal. (A) 201-TI-DDC and (B) 99m-Tc-HMPAO SPECT with coronal slice orientation performed in the same animal (animal 202, 42 weeks). It must be noted that those green pseudo-colored regions in the cortex and the white matter of both hemispheres (panels A and B white arrows) depict a reduction of 201-TI-DDC (panel A) and 99m-Tc (panel B) uptake. In the corresponding histology, we detected infarctions with consequent spongy and cystic tissue destructions (C to E, white arrow heads) and microbleeds (panels C and D asterisks) in those regions with reduced tracer uptakes. Panels C to E show the histologic magnification of the white rectangles in panels A and B. Panel D corresponds to Figure 4F rotated 90° clockwise. HE staining. HE, Hematoxylin–Eosin; MRI, Magnetic Resonance Imaging; 99m-Tc-HMPAO, 99m-Technetium-HMPAO; SHRSP, spontaneously hypertensive stroke-prone rat; SPECT, Single Photon Emission Computed Tomography; 201-TI-DDC, 201-Thallium-Diethyldithiocarbamate.

