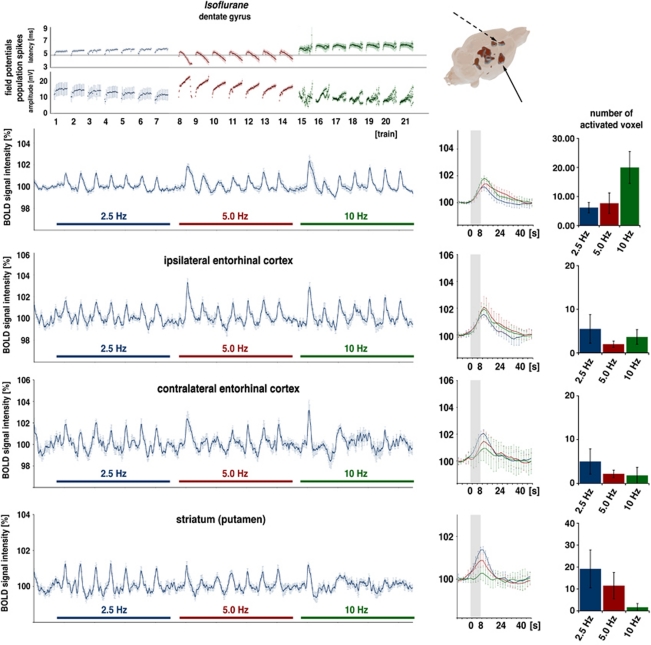
Figure 3.
Electrophysiological responses and variations in blood oxygen level-dependent (BOLD) signal intensities during electrical stimulation of the perforant pathway with repetitive 2.5, 5, and 10 Hz stimulation trains under isoflurane. (Top) Under this condition, stimulus-dependent variations in BOLD signal intensities in the dentate gyrus were observed during 2.5 Hz stimulation trains. Increasing the stimulation frequency caused an increase in the magnitude of the BOLD response in the dentate gyrus, as seen in the event-related average and the number of activated voxels (right). Under isoflurane, significant variations in BOLD signal intensities were not only observed in the right dentate gyrus but also in the right entorhinal cortex, striatum (solid arrow), and anterior cingulated cortex (dashed arrow). Concurrent electrophysiological recordings revealed different response patterns in the dentate gyrus, especially during 5 Hz stimulation trains; a clear augmentation of the population spike amplitude can be observed. (Bottom) BOLD time series in the right and left entorhinal cortex revealing stimulus-dependent variations in the right entorhinal cortex but not in the left side. In the striatum, significant BOLD responses are generated during 2.5 Hz stimulation trains and to a lesser extend during 5 Hz stimulation but not during 10 Hz stimulation trains.

