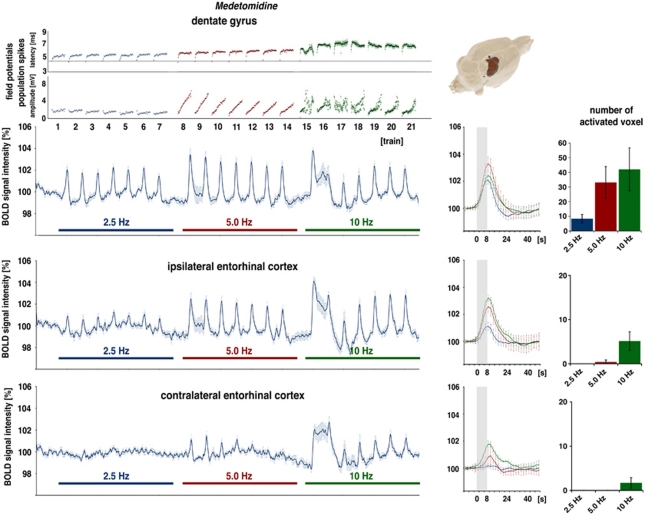
Figure 5.
Electrophysiological responses and variations in blood oxygen level-dependent (BOLD) signal intensities during electrical stimulation of the perforant pathway with repetitive 2.5, 5, and 10 Hz stimulation trains under medetomidine. (Top) Clear BOLD responses in the dentate gyrus observed during 2.5 Hz stimulation trains. Doubling the stimulation frequency to 5.0 Hz in each train increased the magnitude of the BOLD response, whereas another doubling to 10 Hz reduced the magnitude of BOLD responses to a level seen at 2.5 Hz. Electrophysiological responses in the dentate gyrus are similar to that seen under isoflurane (see Figure 3) except that the population spike latencies developed differently during 5.0 Hz stimulation trains. (Bottom) BOLD time series in the right and left entorhinal cortex display a significant stimulus-dependent signal change in the right entorhinal cortex during all trains, and in the left entorhinal cortex only during the 10-Hz stimulation trains.

