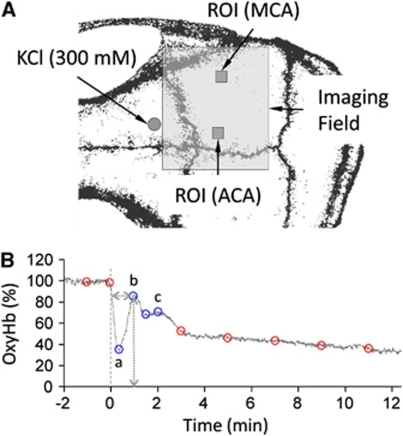
Figure 1.
Experimental design. (A) Imaging field (7 × 6 mm2) was positioned over the right hemisphere. Cortical spreading depression (CSD) was induced by epidural KCl (300 mmol/L) application through a small burr hole overlying the prefrontal cortex (circle). Hemodynamic and metabolic changes were quantified by placing regions of interest (ROI; 0.25 mm2 squares) within the middle or anterior cerebral artery (MCA and ACA) territories. (B) A typical oxyhemoglobin (oxyHb) tracing is shown to demonstrate the method of measurement of hemodynamic and metabolic changes during CSD. The abrupt ‘onset' of hypoperfusion response was taken as time 0. Blue circles indicate the four deflection points defining the multiphasic portion of the response. Both the magnitude of these deflection points, and their latency from response onset were measured in each mouse (e.g., horizontal and vertical dotted lines shown for ‘b'), averaged within each experimental group, and plotted along with additional fixed time points (baseline, and 3, 5, 7, 9, and 11 minutes after response onset, red circles) to reconstruct the waveform.

