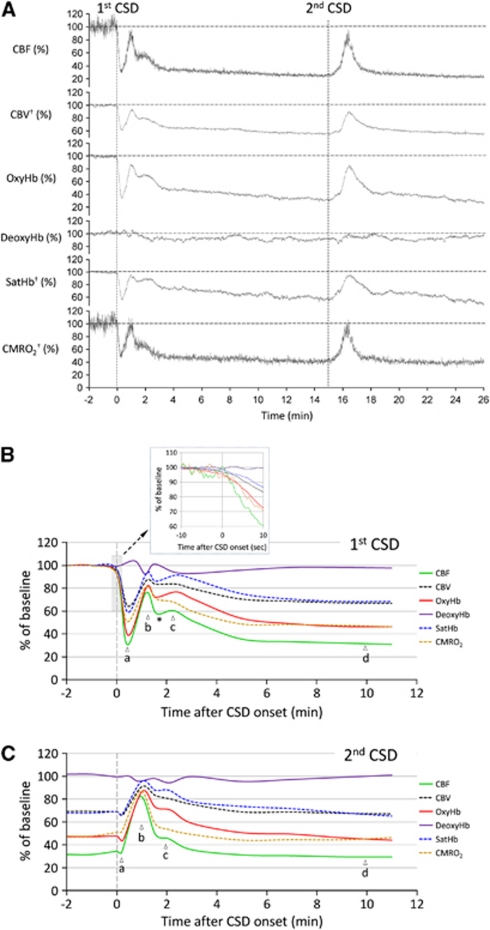
Figure 3.
Time course of hemodynamic and metabolic changes during cortical spreading depression (CSD). (A) Representative tracings showing changes in six hemodynamic and metabolic parameters during two consecutive CSDs measured within the middle cerebral artery (MCA) territory in a female mouse. Vertical dashed lines represent the CSD onset. All six parameters are shown relative to their pre-CSD baseline. †, calculated using CBF, oxyHb and deoxyHb. (B) The averaged time course of hemodynamic and metabolic response to the first CSD in female mice (n=6). Inset shows the onset of CSD response (gray-shaded box) on expanded time scale. The profound hypoperfusion and deoxygenation (a), the transient recovery (b), the second small rise (c), and post-CSD oligemia (d), as well as the transient dip between b and c (*) are indicated. (C) The averaged time course of hemodynamic and metabolic response to the second CSD in female mice. The response to second CSD was mainly monophasic. Please note that changes in hemoglobin O2 saturation (SatHb) are shown as percent of baseline, rather than actual percent saturation. Solid curves indicate measured, dashed curves indicate calculated parameters. Vertical dashed line represents the CSD onset. Error bars are omitted for clarity and can be seen in Figure 4C.

