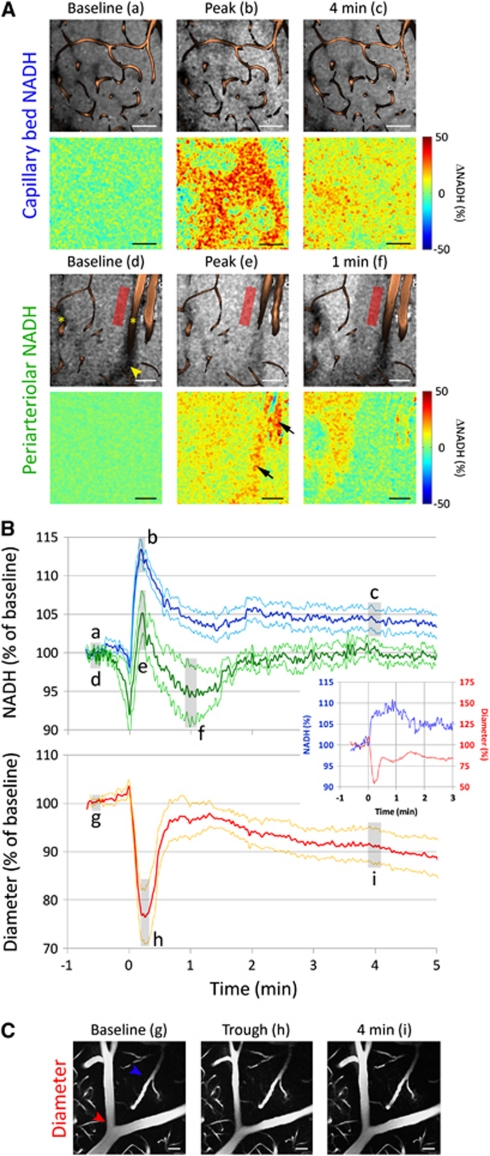
Figure 5.
Time course of nicotinamide adenine dinucleotide (NADH) fluorescence and arteriolar diameter changes during cortical spreading depression (CSD) measured by two-photon imaging. (A) Representative raw (upper row) and relative (lower row) images show the NADH changes in capillary bed (upper group) and periarteriolar tissue (lower group) to CSD. Vessels, labeled by fluorescein isothiocyanate (FITC)-dextran, are superimposed on the raw images. The NADH increase in capillary bed was spatially heterogeneous without a consistent relationship to capillaries, whereas the periarteriolar response in the vicinity of penetrating arterioles (asterisks) was more muted. The timings of images (a–f) are shown in panel B. Red rectangle shows a typical periarteriolar region of interest (ROI). The apparent NADH increase overlying the larger arteriole (arrows) represents movement of the vessel out of the imaging plane, and shrinking of the shadow of the vessel above the imaging plane (yellow arrowhead), due to vasoconstriction; such artifacts were routinely avoided during ROI placement. (B) The averaged time course of NADH signal changes in capillary bed (blue, n=15 CSDs in seven mice) and periarteriolar tissue (green, n=5 CSDs in four mice) during a CSD are shown together with changes in arteriolar diameter (red, n=7 CSDs in four mice). In the capillary bed, CSD was associated with an abrupt increase in NADH fluorescence preceded by a small and brief dip. After the peak, NADH levels remained elevated for at least 5 minutes. In contrast, periarteriolar NADH showed a bigger initial dip and a smaller peak increase, followed by a transient undershoot below baseline; there was no persistent NADH increase in periarteriolar tissue after a CSD (P<0.05 versus capillary bed). The abrupt onset of vasoconstriction temporally corresponded to the initial NADH dip in all mice (inset shows a representative experiment). Arterioles remained mildly constricted for at least 5 minutes after a CSD, closely resembling the cerebral blood flow (CBF) and cerebral blood volume (CBV) changes obtained using laser speckle and multispectral imaging (Figures 3 and 4). Gray-shaded regions (a–i) indicate the approximate timing of images shown in panels A and C. Periarteriolar NADH was measured only when a penetrating parenchymal arteriole was present in the imaging field, whereas diameter changes were measured when a pial or penetrating arteriole was present. Data are mean±standard error (thick and thin lines, respectively). (C) A representative pial arteriole (red arrowhead) shows the vasoconstrictive response to CSD. In contrast, capillary or venous diameters (blue arrowhead) did not change during CSD, although red blood cell flow arrest was visible in some vessels during the trough. Calibration bars=50 μm. Representative experiments are shown in Supplementary Movies 3 and 4.

