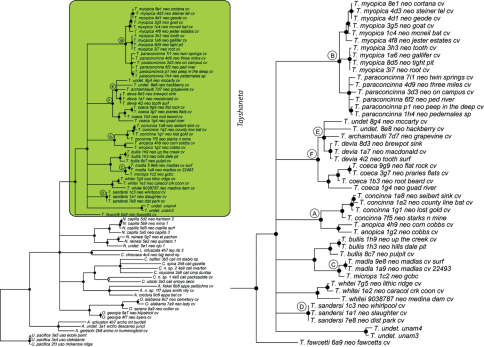
Figure 7.
Bayesian gene tree, cytochrome oxidase I (COI) from Ledford et al. (2011). Highlighted and enlarged area indicates Tayshaneta. Black nodes correspond to a posterior probability >95%. Tayshaneta highlighted in green and enlarged at right. A anopica species-group B myopica species-group C microps species-group D sandersi species-group.

