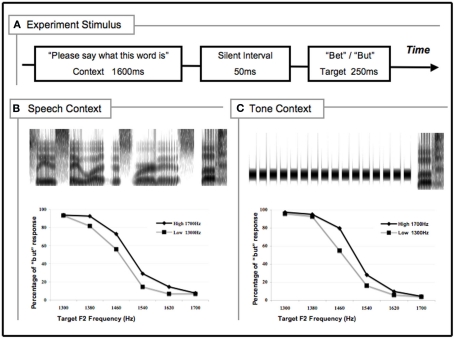
Figure 2.
Stimulus design and results of the experiment. (A) Schematic illustration of stimulus components; (B) spectrogram in time x frequency dimensions for the high mean speech context (top panel) and mean percentage of “but” responses in speech contexts (bottom panel); (C) spectrogram in time x frequency dimensions for a representative high mean tone context (top panel) and mean percentage of “but” responses in tone context (bottom panel). Preceded by both speech (B) and tone (C) contexts, higher-frequency contexts led to more low-frequency target responses (“but”), and vice versa.

