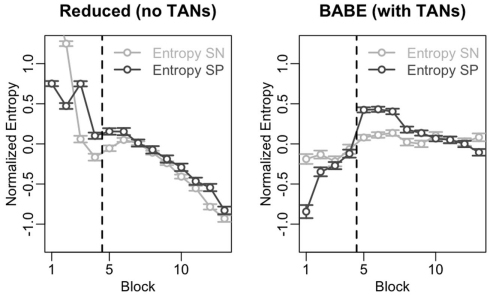
Figure 6.
Time course of the entropy level in the SN and SP cells across the 13 blocks of Test 2 for the reduced (left) and full version (right) of the BABE model. The dark gray lines and circles represent entropy in the SP cells; the light lines and circles represent entropy in the SN cells. Points represent mean values, and the vertical line indicates the point where the success contingencies were reversed during the test.

