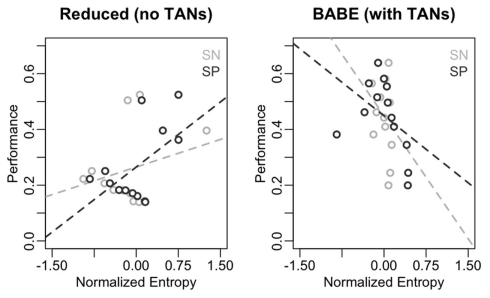
Figure 7.
Correlations between performance and entropy levels for the reduced (left) and full version (right) of the BABE model. Performance (for the AB pairs only) is the abscissa, and entropy on the ordinate; The dark circles represent the SP cells; the dark dotted lines represents the regression lines for the SP cells; the light lines and circles represent entropy the SN cells; the dark dotted lines represents the regression lines for the SN cells.

