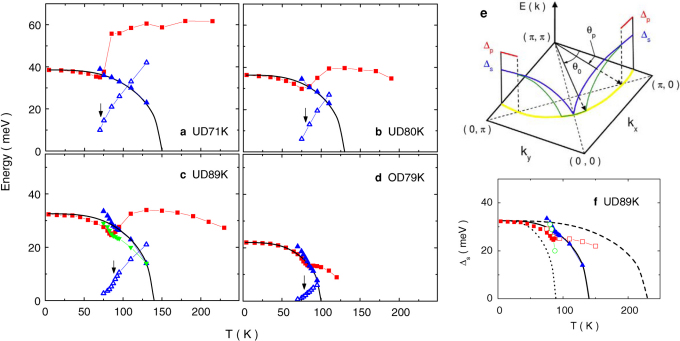
Figure 2. Measured and fitted quantities showing that the superconducting gap Δs closes at Tc0 (Tc < Tc0 < T*), above which a pseudogap already exists.
(a–d) squares: half the conductance peak position in meV; up-triangles: superconducting gap Δs (solid) and lifetime parameter γs (open) obtained by fitting the normalized spectra σ(V, T)/σ(V, Tc0) using Ns(θ, ω) excluding the pseudogap-dominant region from 0 to θp on the Fermi surface. Above Tc (indicated by arrows), Δs is seen to follow nicely the BCS d-wave gap (lines) closing at Tc0 = 150, 130, 140, 100 K, respectively. In (c) Δs obtained from fit considering the entire Fermi surface is plotted as down-triangles for comparison. (e) symbols and schematic gap profiles on the Fermi surface (yellow) in the temperature ranges of well below Tc (blue) and from Tc0 to T* (red). From near Tc to Tc0, half the peak separation of A(kF, ω) is shown (green) with a Fermi arc as observed in ARPES experiment. (f) Δs of the UD89K sample obtained from fits to the normalized σ(V, T)/σ(V, T*) (open squares) and σ(V, T)/σ(V, Tc) (circles) tunneling spectra. Both deviate considerably from the BCS gap closing at respective temperatures (dashed and dotted lines), as compared to the result from fit to σ(V, T)/σ(V, Tc0) (up-triangles, also in c) that shows a good agreement with the BCS prediction (solid line) above Tc (see text for more details).

