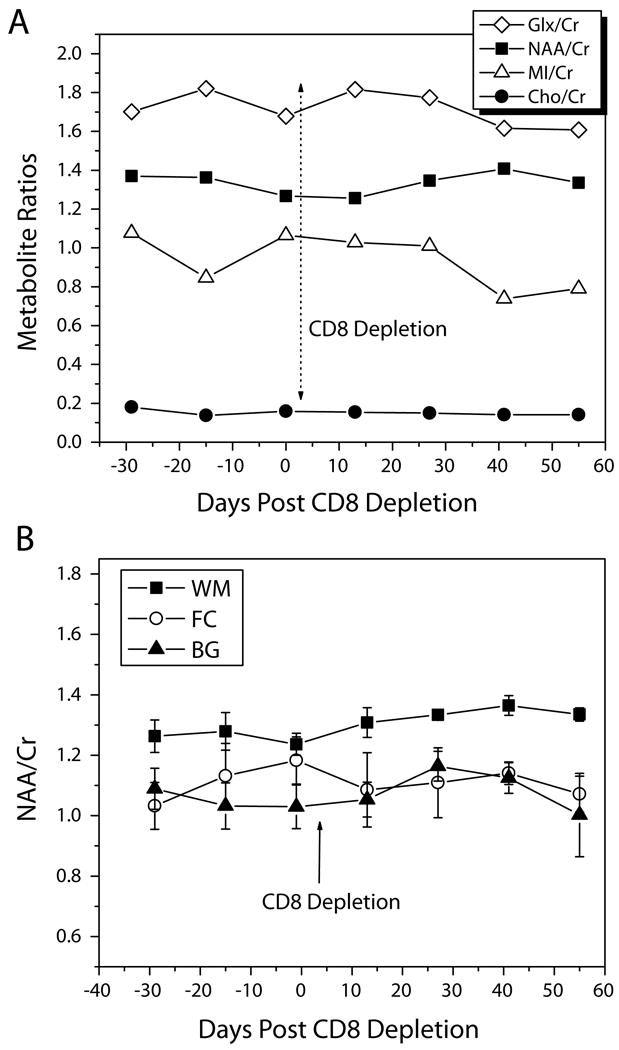
Figure 2.

Figure 2 (a). Changes in Glx/Cr, NAA/Cr, MI/Cr, and Cho/Cr in the white matter semiovale before and after CD8+ lymphocyte depletion in one representative animal over time. None of the metabolite ratios showed any change due to the anti-CD8 treatment.
Figure 2 (b). Mean NAA/Cr ratios of the four CD8-depleted animals in the white matter (WM), frontal cortex (FC), and basal ganglia (BG) as a function of time post-CD8 depletion. No significant changes in any of the brain regions over time were found.
The error bars represent standard error of the mean (SEM).
