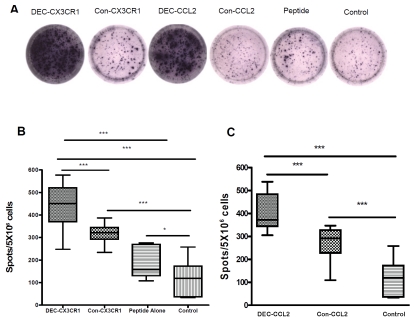
Figure 4.
DNA vaccination induced significant cellular responses of splenic IFN-γ-producing T cells as examined by enzyme-linked immunospot assay. (A) Represented spots on each group as indicated shown a large number of spot forming cells in DEC-CX3CR1 and DEC-CCL2 vaccinated mice. (B) quantitative analysis shown that there are significantly higher number of IFN-γ-producing splenic T cells in DEC-CX3CR1 vaccinated mice than in other groups, (value = mean ± SEM, all ***p < 0.001). (C) quantitative analysis shown that there are significantly higher number of IFN-γ-producing splenic T cells in DEC-CCL2 vaccinated mice than in other groups, (value = mean ± SEM, both ***p < 0.001).

