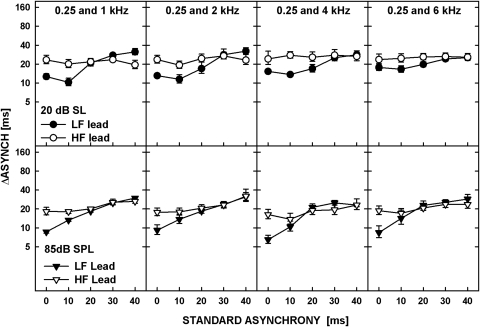
Figure 6.
Thresholds for detecting an increase in delay between two tones in a pair, averaged across six listeners are plotted as a function of the standard asynchrony. The data are plotted separately for the low-frequency tone leading (filled symbols) and the high-frequency tone leading (open symbols). The upper panels show data for the tones at 20 dB SL, and the lower, for 85 dB SPL. Different columns show data for different frequency pairs, shown in the legend of upper panels.

