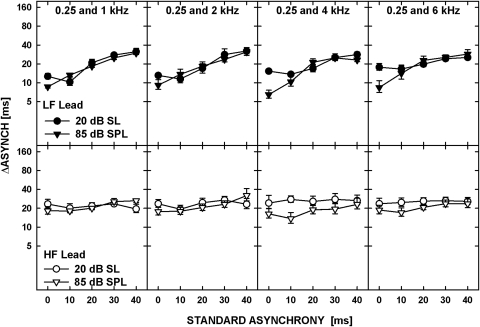
Figure 7.
Data replotted from Fig. 6. The upper panel shows the data for the low-frequency tone leading, for two levels of the tones, 20 dB SL (circles) and 85 dB SPL (triangles). Lower panels show the data for the high-frequency tone leading. Each column is for a different frequency pair as shown by the legends in the upper panels.

