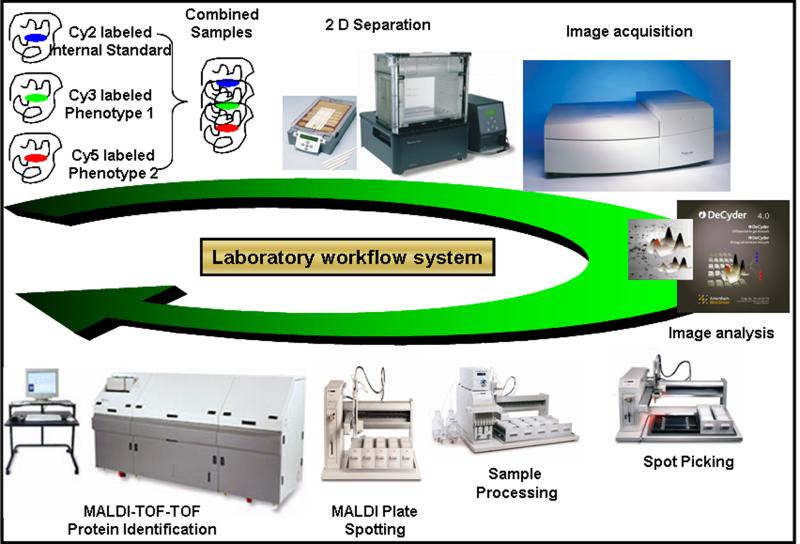
Figure 3. 2D-DIGE work-flow for comparative expression-proteomics.
Samples are labeled with fluorescent dyes (Cy 2, 3 and 5) and combined together prior to the IEF. An optimized protocol based on the tissue of interest is used for the IEF and second dimension separation of proteins. The three gel images are scanned by Typhoon™ scanner (GE Healthcare) so that the maximum pixel intensities are within the linear dynamic range and at the same time are consistent across the entire set of gels in the experiment. The differentially regulated protein spots, after the image analyses by DeCyder™ analysis software, are picked by robotic picker. These spots are robotically processed, including in-gel digestion, and prepared for acquiring mass spectra (MS and MS/MS) by MALDI-TOF-TOF. The acquired mass spectra are searched against the protein database, using MASCOT search engine, for the species of interest to obtain protein identification.

