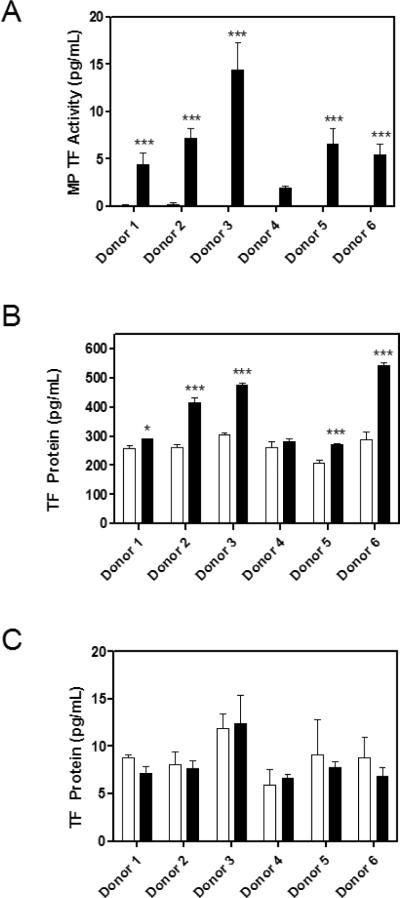
Figure 2. MP TF activity and protein in samples prepared from blood with and without LPS stimulation.
Whole blood from 6 donors was either stimulated for 5 hours with LPS (10 μg/mL) or left untreated. PPP from blood with or without LPS stimulation was analyzed for A) MP TF activity and TF protein by B) IMUBIND® TF ELISA and C) ZYMUTEST TF ELISA. Black bars represent MP isolation from LPS treated blood and white bars indicate MPs isolated from untreated blood. Samples were run in triplicate, *p<0.05, ***p<0.001, two-way ANOVA post-test.

