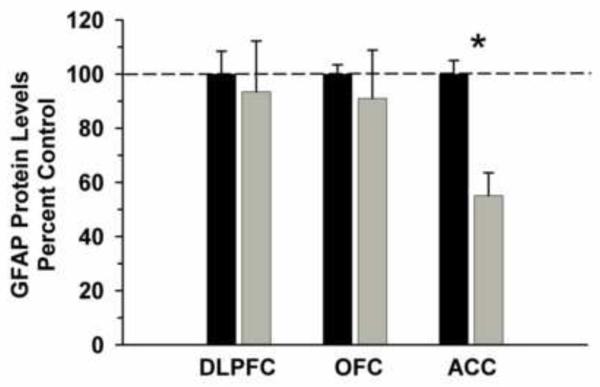
Figure 7.
GFAP protein levels in prefrontal cortical brain regions of ethanol consuming and control cynomolgus monkeys. Cytosolic fractions were isolated and separated on 10% SDS-PAGE. Data are expressed as mean (± S.E.M.) of the percent of control values per amount of protein loaded. Asterisks indicate a significant difference (P<0.05).

