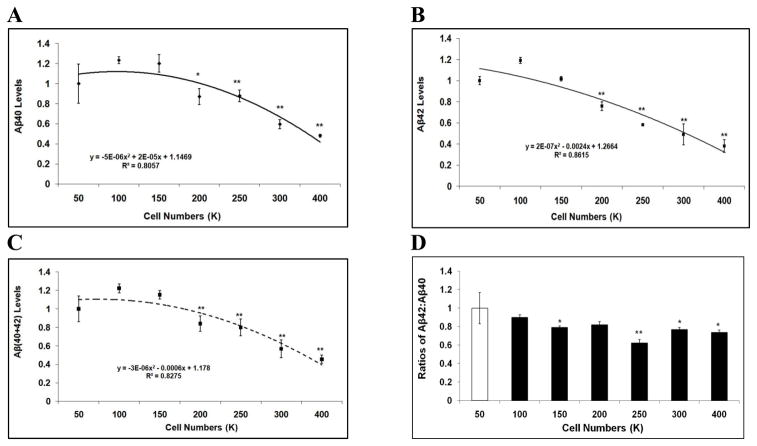
Figure 2. Aβ40 and Aβ42 levels vary depending on cell density in H4-APP751 cells.
Cells of different numbers were seeded on 6-well plates. Conditioned media and cell lysates were collected after 48h. Cell lysates were applied to BCA assay to calculate protein concentration. Conditioned media were applied to ELISA to calculate Aβ40 and Aβ42 levels, which were then normalized to protein concentration. The Aβ40 and Aβ42 values represented in the figure were normalized values. The values of Aβ40, Aβ42, Aβ(40+42), and the Aβ42:Aβ40 ratio from higher cell densities were compared to those from 100K. A-C At higher seeding densities (200K-400K), the levels of Aβ40 (A), Aβ42 (B), and Aβ(40+42) (C) significantly decreased versus 100K. D. The ratio of Aβ42:Aβ40 was also reduced with increasing seeding densities (n=3 for each treatment group; mean ± S.E.; *p<0.05; **p<0.01).

