Figure 3.

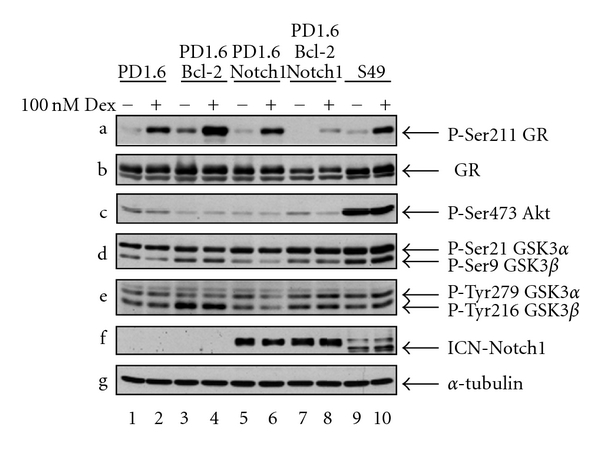
PD1.6Bcl-2Notch1 cells show reduced GR expression. Western blot analysis of untreated or Dex-treated (100 nM, 2 hrs) cells. α-Tubulin was used as loading control.

PD1.6Bcl-2Notch1 cells show reduced GR expression. Western blot analysis of untreated or Dex-treated (100 nM, 2 hrs) cells. α-Tubulin was used as loading control.