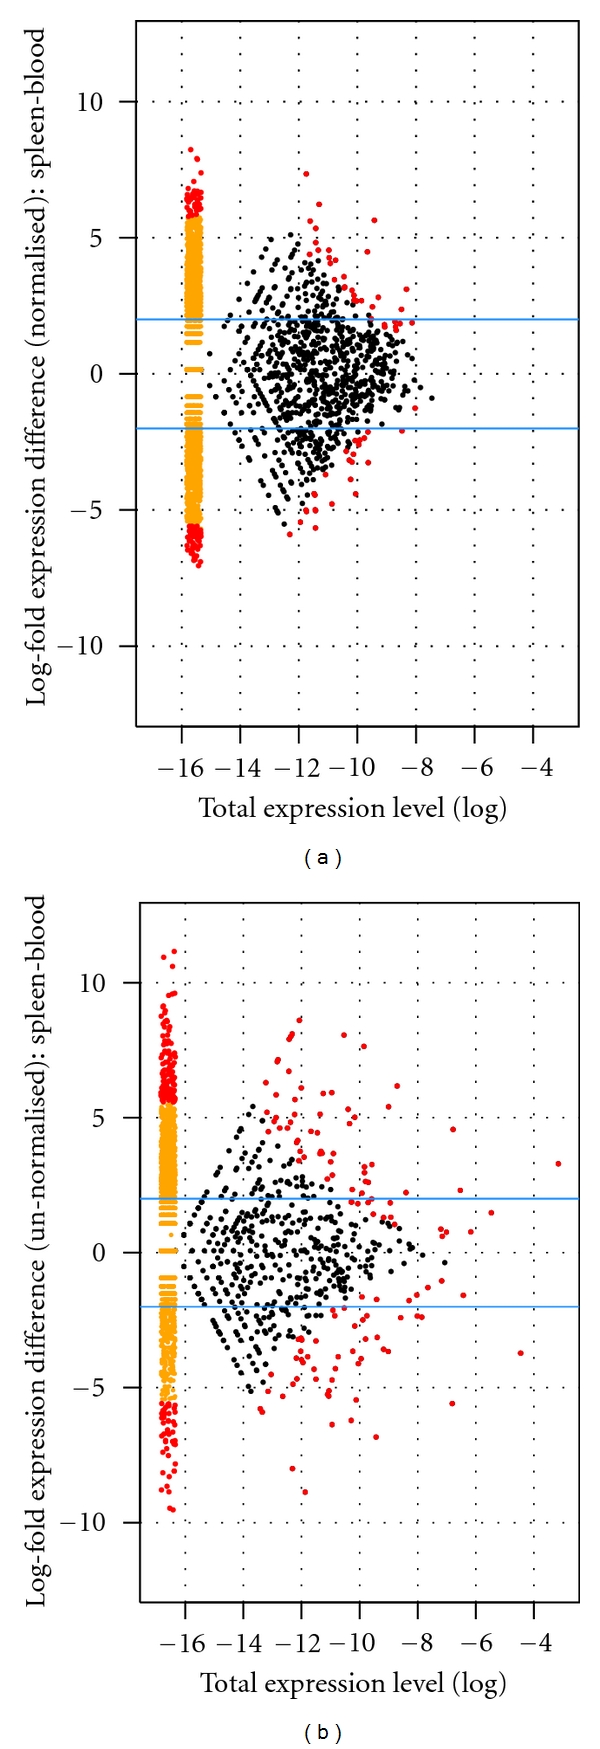
Figure 4.

Differential expression of genes between spleen and blood, data from (a) normalised cDNA libraries and (b) unnormalised libraries. Positive log-fold differences indicate higher expression in spleen than in blood. The blue horizontal lines represent fourfold differences in expression between tissues. Genes expressed in only one tissue are plotted in yellow smears to the left of the graphs. Red points represent genes showing significant expression divergence between tissues (P < 0.05, after applying an FDR multiple test correction).
