
Figure 2.
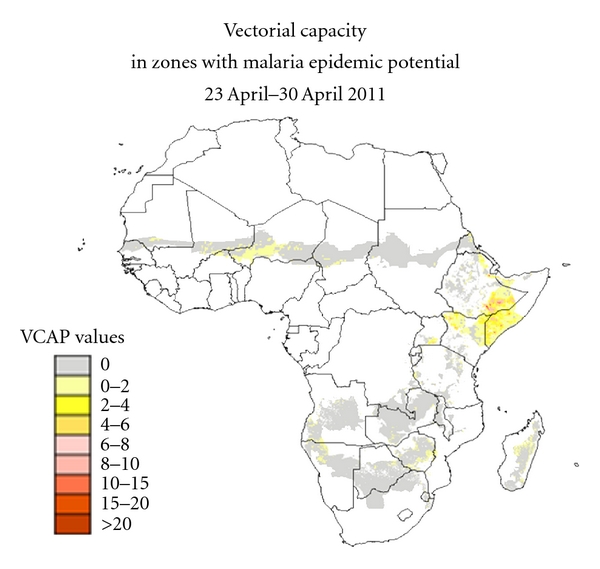
Vectorial capacity map produced by USGS EROS Center. The VCAP values are provided for the epidemic zones of Africa at 1 km spatial resolution. The map has been updated every 8 days since January 2004.
Official websites use .gov
A
.gov website belongs to an official
government organization in the United States.
Secure .gov websites use HTTPS
A lock (
) or https:// means you've safely
connected to the .gov website. Share sensitive
information only on official, secure websites.
Vectorial capacity map produced by USGS EROS Center. The VCAP values are provided for the epidemic zones of Africa at 1 km spatial resolution. The map has been updated every 8 days since January 2004.