
Figure 9.
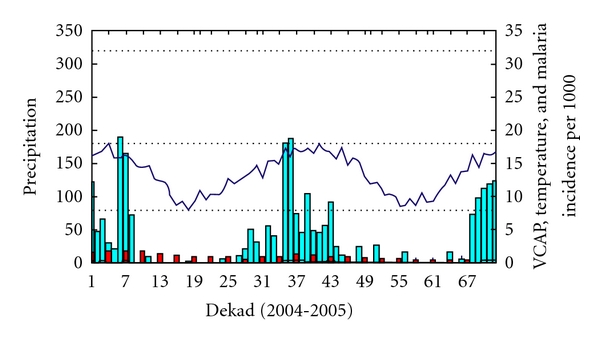
Region 2: the black line represents the VCAP values (very low values close to 0), the blue bar represents rainfall (mm/dekad with values reaching 200 mm), the blue line represents temperature (temperature below 18°C), and the red bar represents malaria incidence per 1000 habitants.