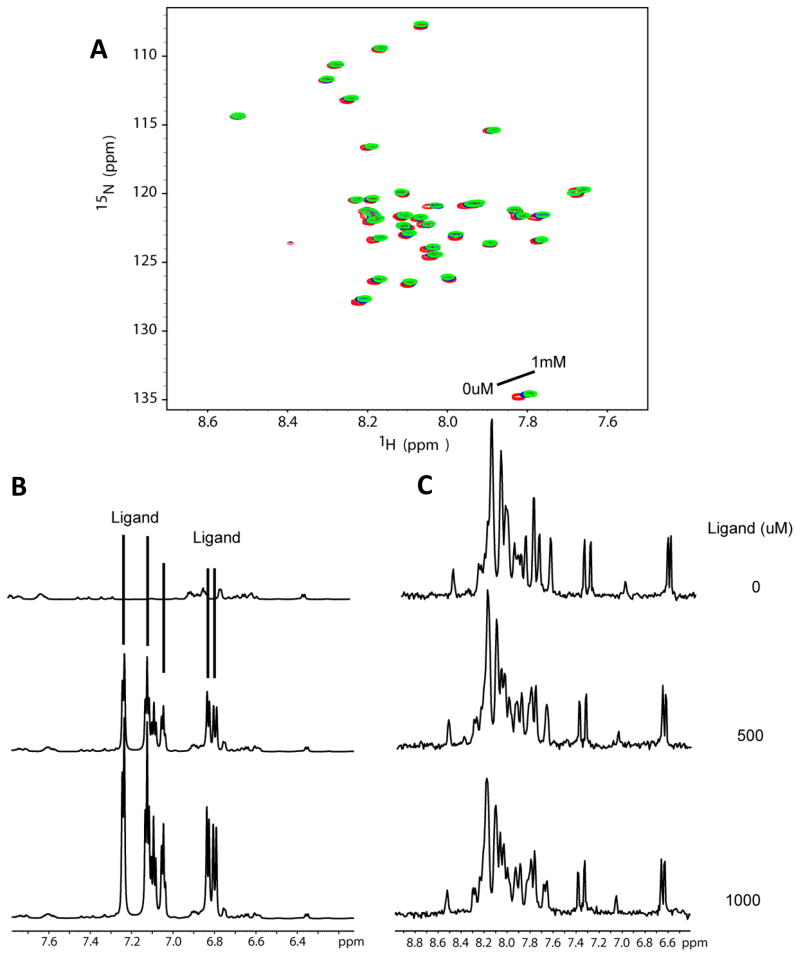
Figure 5.
Titration of U-15N-Aβ42 with flurbiprofen. (A) 15N-HSQC spectra of Aβ42 upon titration of flurbiprofen at concentrations of 500uM and 1mM. There are no shifts in the peaks of these spectra beyond what is observed for the DMSO-only control titration (see Fig. 6) and peak intensities do not vary. (B) 1H NMR spectra taken at each titration point to allow observation of ligand peaks throughout the titration. It can be seen that the flurbiprofen peaks remain sharp throughout, reflecting the fact that this compound does not aggregate at concentrations below 1 mM. (C) 1-D 1H NMR projections of the HSQC spectra shown in panel A demonstrate that the solubility of Aβ42 remains unchanged at all titration points.

