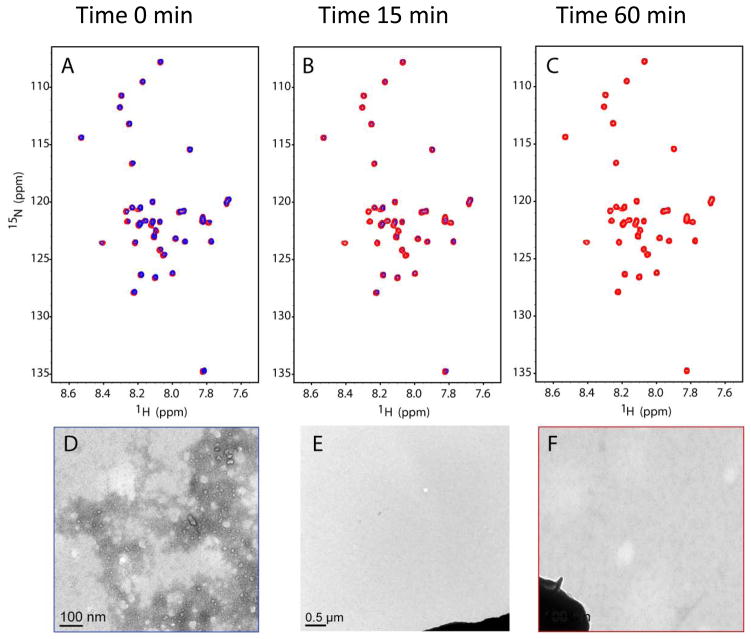
Figure 7.
Time course 15N-HSQC spectra of 100 μM U-15N-Aβ42 following addition of sulindac sulfide to 300uM. Panels A, B, and C show spectra taken of 100μM Aβ42 alone (red) and upon addition of sulindac sulfide (blue) at times = 0, 15min, and 1hr, respectively. Notice the decrease in intensity of all the blue peaks as Aβ42 begins to form aggregates. Panels D, E, and F show transmission electron micrographs (66,000x) of 100μM Aβ42 NMR samples fixed to a TEM grid approximately 2hrs after addition of (D) 300uM sulindac sulfide, (E) 300uM sulindac sulfide alone (no protein, 11,600x), and (F) DMSO-only to a final concentration of 2%, matching that in D and E (dark blob in E and F is grid bar included for camera gain). In D, fibrils of Aβ42 are clearly visible.

