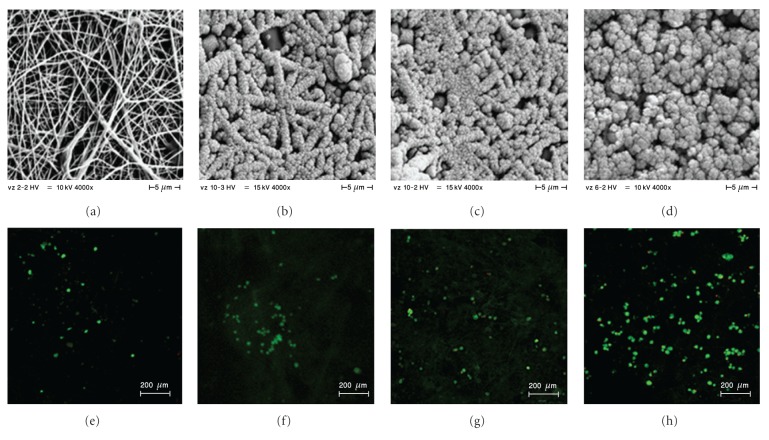
Figure 1.
Visualization of scaffolds by SEM and confocal microscopy. Prepared scaffolds were visualized using SEM (a, b, c, d). On day 7, MSCs were stained using BCECF-AM and propidium iodide for live/dead staining, and samples were visualized by confocal microscopy (e, f, g, h); PCL/PVA (a, e), PCL/PVA200HA (b, f), PCL/PVA400HA (c, g), and PCL/PVA800HA (d, h).

