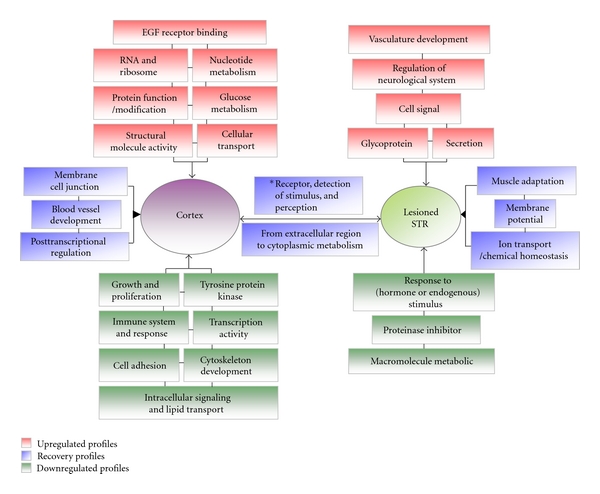
Figure 6.

A scheme of functional annotation for transcripts in the 16 types of profiles (for discussion). There were 16 types of profiles for the differential transcripts in the three experimental groups of the cortex or lesion-lateral STR (control, model, and EA group). These profiles can be mainly divided into 5 subgroups after 100 Hz EA treatment (Figure 3). Here, the schematic summarizes the related major functional categories of the transcripts regulated in 16 types profiles (Tables S2–8). Red represents the functional annotation for the upregulated transcripts. Green represents the functional annotation for the downregulated transcripts. Blue represents the functional annotation for the transcripts that returned the levels of gene expression to control values. *This box includes olfactory receptor activity, detection of chemical stimulus involved in sensory perception of smell, G-protein coupled receptor protein signaling pathway, cell surface receptor linked signal transduction, cognition or neurological system process, and sensory perception (Table S2).
