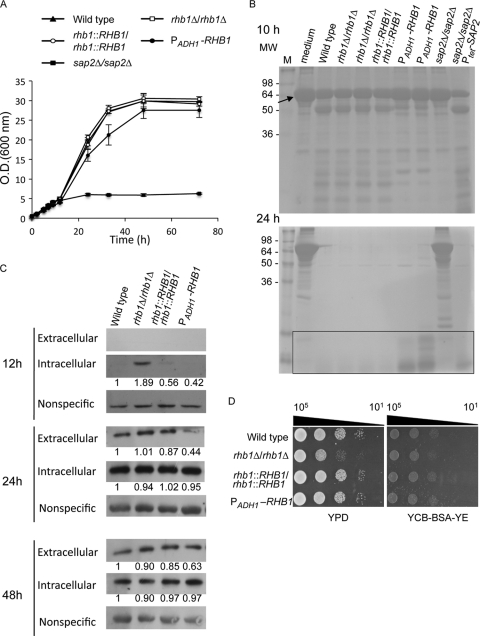
Fig 1.
Rhb1 regulates cell growth in medium with BSA as the major nitrogen source by controlling C. albicans Sap2 expression. (A) Cells were grown in YPD broth overnight, washed twice with sterile water, and subcultured in YCB–BSA–YE (0.01%) medium (initial cell density, OD600 = 0.5) at 30°C. The C. albicans strains used in this experiment were SC5314 (wild type; filled triangles), CCT-D1 (rhb1 deleted; open squares), CCT-RD1 (RHB1 reconstituted; open circles), CCT-OE1 (overexpressing RHB1; filled circles), and SAP2MS4A (sap2 deleted; filled squares). The doubling times for wild-type, rhb1-deleted, and RHB1-reconstituted strains were approximately 5.7 ± 0.2 h, 5.8 ± 0.02 h, and 5.7 ± 0.1 h, respectively. The doubling time for the strain overexpressing RHB1 in YCB–BSA–YE (0.01%) was approximately 6.1 ± 0.4 h. (B) BSA degradation by C. albicans after 10 and 24 h of incubation. Each cell supernatant (20 μl) was analyzed by 12% SDS-PAGE, and proteins were visualized by Coomassie blue staining. Data represent the results of only 1 experiment, although experiments were performed at least 3 times with identical results. The rectangular box indicates peptides or low-molecular-weight proteins derived from BSA degradation. The arrow indicates the intact BSA (66 kDa). M, protein molecular marker; MW, molecular weight. (C) Expression of extracellular and intracellular Sap2 in different C. albicans strains. Cells were grown as described in panel A for 12, 24, and 48 h, and Sap2 was detected by Western blotting. The nonspecific band served as the loading control and was used to normalize the intracellular Sap2 levels indicated by the fold change values. (D) Comparison of levels of cell growth on YPD and YCB–BSA–YE (0.01%) agar plates. Cells were grown overnight in YPD, washed, serially diluted 10-fold, and spotted onto agar plates. Plates were photographed after incubation at 30°C for 1 day. Data are representative of at least 3 independent experiments with identical results. Cell numbers are shown at the top of the panels.

