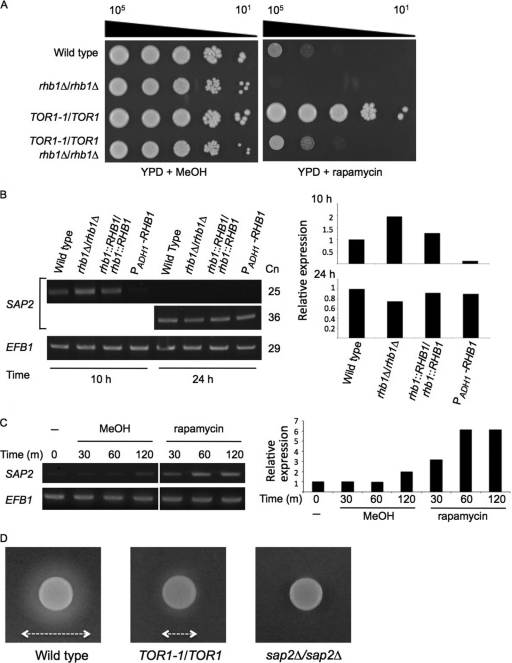
Fig 2.
Tor1 kinase regulates SAP2 expression and affects Sap2 protease secretion. (A) Epistatic interaction between Rhb1 and Tor1 kinase. Tenfold serial dilutions of each strain were prepared and spotted onto YPD with 0.01-μg/ml rapamycin or with 0.1% methanol (MeOH [the vehicle control]). Plates were incubated at 30°C for 2 days. Data are representative of at least 3 independent experiments with identical results. Cell numbers are shown at the top of the panels. (B) SAP2 expression in different C. albicans strains. Cells were grown as described in the Fig. 1A legend for 10 and 24 h, and SAP2 expression was analyzed with RT-PCR. EFB1 served as an endogenous control. Cn, number of cycles in the PCRs. The semiquantitative levels of SAP2 induction were calculated and plotted. (C) Induction of SAP2 expression by rapamycin treatment. The SC5314 strain was incubated in SD medium at 30°C until reaching mid-log phase. The cell pellets were washed and subsequently subcultured in SD (−), SD containing 0.2% methanol (MeOH [the vehicle control]), or SD containing 0.2-μg/ml rapamycin. After cells were grown for the indicated times, the level of SAP2 expression was detected with RT-PCR. EFB1 served as an endogenous control. The semiquantitative levels of SAP2 induction were calculated and plotted. m, minutes. (D) Assay for Sap2 secretion by BSA degradation. Approximately 2.5 × 10⁵ cells of the SC5314, JRB12 (TOR1-1/TOR1), and SAP2MS4A (sap2Δ/sap2Δ) strains were spotted on YCB–BSA–YE (0.01%) agar plates containing rapamycin (0.01 μg/ml) and incubated at 37°C for 4 days. The double arrows indicate the diameter of the proteolytic zone.

