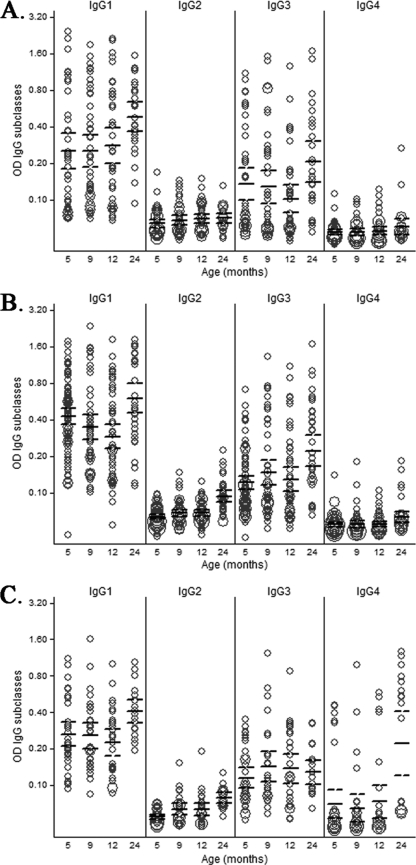
Fig 2.
IgG subclass responses to MSP-119 (A), AMA-1 (B), and EBA-175 (C) in children up to age 2 years of age. Only data for children receiving IPTi with placebo are depicted here. IgG levels (y axes) are expressed as OD values. In the weighted scatter plots, the area of the symbol is proportional to the number of observations. Geometric mean IgG levels and 95% confidence intervals are indicated by horizontal continuous and dashed lines, respectively.

