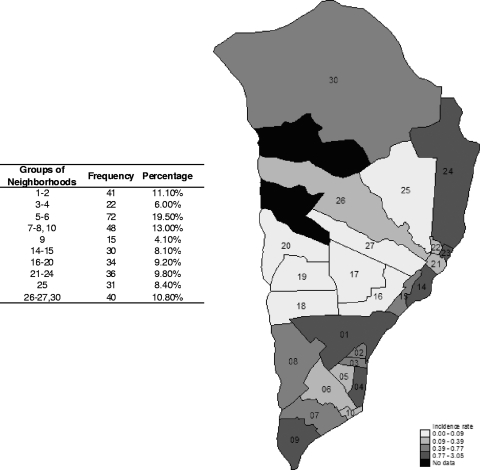
Fig 3.
Map of the Manhiça area with the neighborhoods colored as a function of malaria incidence (number of episodes per PYAR) for children selected for the study during the study period. The map illustrates the geographical microheterogeneity and the significant effect of neighborhood on malaria episodes and antibodies in the multilevel regression models. The study area expands a distance of less than 20 km from north to south and approximately 10 km from east to west and has two study clinics (Manhiça and Maragra). The number of children by groups of neighborhoods is indicated in the table.

