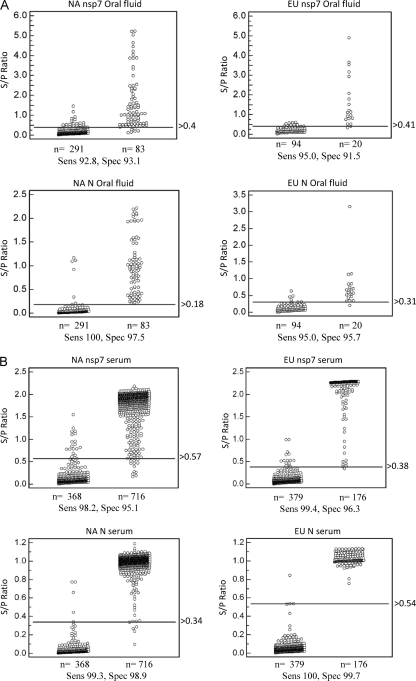
Fig 4.
Determination of diagnostic sensitivity (Sens) and specificity (Spec) by ROC analysis of oral fluid-based FMIA (A) and serum-based FMIA (B). Diagnostic sensitivity and specificity were calculated using samples from a known PRRSV-infected swine population (103 oral fluid and 892 serum samples) and a known PRRSV-negative swine population (385 oral fluid and 368 serum samples). ROC analysis was performed using MedCalc, version 10.4.0.0 (MedCalc Software, Mariakerke, Belgium). In each panel, the dot plot on the left represents the negative population, and the dot plot on the right side represents the positive population. A horizontal line between the positive and negative populations represents the cutoff value that gives the optimal diagnostic sensitivity and specificity.

