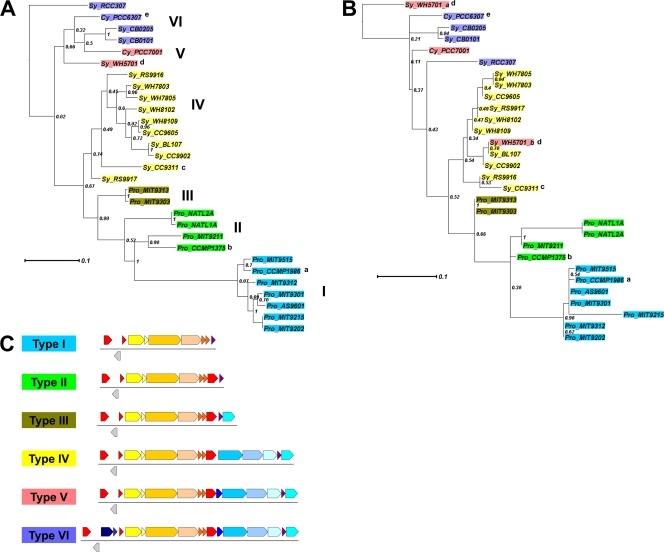
Fig 6.
Phylograms of α-cyanobacteria based on IF-2 (A) or CsoS1D (B). Trees are constructed with maximum likelihood (PhyML) with 100 bootstrap replicates. Numbers along the internodes are the percentage of instances each node was supported in 100 bootstrap replicates. Color coding shows types as indicated in panel C. Pro, Prochlorococcus; Sy, Synechococcus; Cy, Cyanobium; a, also known as MED4 or CCMP1378; b, also known as SS120; c, exception—no cbbX and having three additional open reading frames (details in Table 2); d, csoS1D is not present upstream from the cso operon but there are 2 copies of csoS1D genes elsewhere in the genome, marked as “Sy_WH5701_a” and “Sy_WH5701_b” in panel B; e, exception—no cbbX. (C) Schematic diagram of type I to type VI cso gene clusters. The color scheme for genes uses warm colors for previously known cso genes and cold colors for proposed putative cso genes.

