Fig 5.
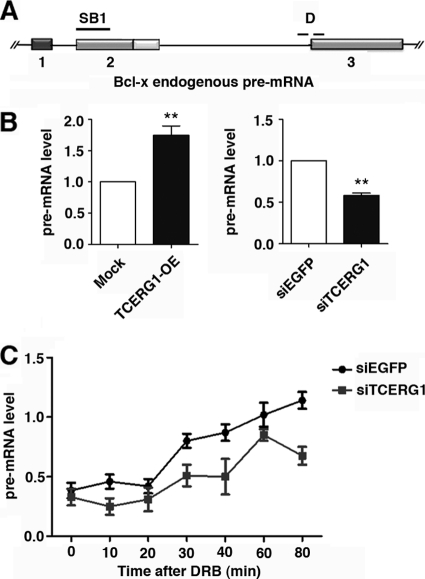
TCERG1 increases the rate of RNAPII transcription in vivo. (A) Schematic representation of the structure of the Bcl-x gene, drawn with exons (boxes) and introns (lines). The position of the SB1 element and of the primers spanning the intron-exon 3 junction (D) used to amplify transcripts by qRT-PCR are indicated. (B) Quantitative analysis of the amount of nascent Bcl-x transcripts. (Left) HEK293T cells were transfected with an empty vector (mock) or the TCERG1 overexpression (OE) plasmid. (Right) HEK293T cells were transfected with siRNAs against EGFP or TCERG1. The quantification of the experimental data from four independent experiments performed in triplicates is shown in graphic form (means ± standard deviations [SD]). **, P < 0.01. (C) Kinetics of RNAPII-dependent transcription elongation in the presence or absence of TCERG1. HEK293T cells were transfected with siEGFP or siTCERG1 and treated 48 h later with 100 μM DRB for 3 h. After DRB removal, fresh medium was added and samples were taken at the times indicated. qRT-PCR was performed using primer set D to measure the levels of pre-mRNA expression. The graph shows pre-mRNA levels at different times from the control (siEGFP) or TCERG1-depleted cells (siTCERG1). The data shown are the averages from triplicates of two independent experiments (means ± SD). *, P < 0.05; **, P < 0.01.

