Fig 6.
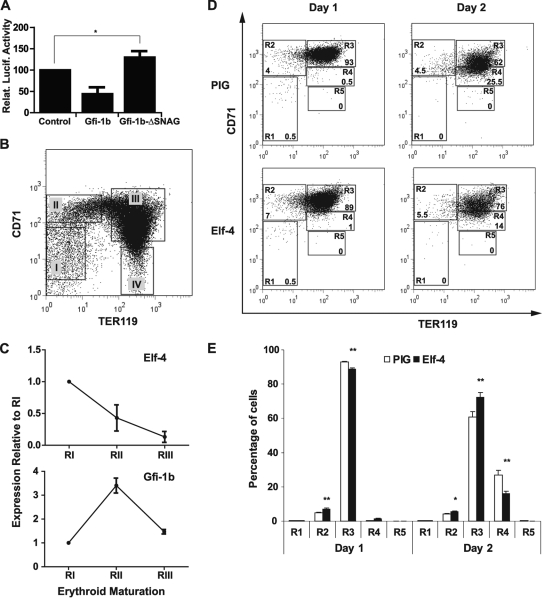
Overexpression of Elf-4 delays erythroid maturation during in vitro differentiation of E14.5 fetal liver cells. (A) Repression of the Elf-4 −30P promoter by overexpression of Gfi1b in the J2E cell line. Cotransfection of the Elf-4 −30P luciferase reporter construct with either MigRI (control), MigRI-Gfi1b, or MigRI-Gfi1b-ΔSNAG expression plasmids was analyzed in the J2E cell line. Luciferase values are expressed relative to the control, and the means from four independent transfections performed in triplicate are shown. Error bars indicate the standard errors of the means. Statistically significant differences (based on Student's t test) are indicated with an asterisk (P ≤ 0.05). (B) Four populations of murine E14.5 fetal liver cells isolated by flow cytometry and representing sequential stages of erythroid differentiation: (I) CD71−/low TER119−; (II) CD71+ TER119−; (III) CD71+ TER119+; (IV) CD71− TER119+. (C) Expression of Elf-4 and Gfi1b during in vivo terminal erythroid differentiation in the fetal liver. Real-time PCR analysis for the expression of Elf-4 and Gfi1b was performed on E14.5 fetal liver cells sorted by flow cytometry (regions I to III). The gene expression levels of each population were normalized to mouse 18s, and the data are presented as the expression level relative to that at stage I. Error bars indicate standard deviations. (D) Representative FACS plots for TER119 and CD71 expression during in vitro differentiation in lineage-negative E14.5 fetal liver cells overexpressing Elf-4 or a control (PIG) vector after 24 h (day 1) or 48 h (day 2). Five populations corresponding to stages of erythroid differentiation from progenitors to enucleated cells were gated: R1, CD71−/med TER119−; R2, CD71high TER119low; R3, CD71high TER1119high; R4, CD71med TER1119high; R5, CD71low TER1119high. Percentages of GFP+ cells in each of these stages are indicated. (E) Bar charts indicating the proportions of cells at each of the five stages of erythroid differentiation (R1 to R5) after 24 h (day 1) and 48 h (day 2) of in vitro culture of lineage-negative E14.5 fetal liver cells retrovirally transfected with an overexpressing Elf-4 or control (PIG) vector. A representative plot (with means and standard deviations) for one experiment, performed in triplicate, is shown. Statistically significant differences (based on Student's t test) are indicated with asterisks: *, P ≤ 0.05; **, P ≤ 0.01.

