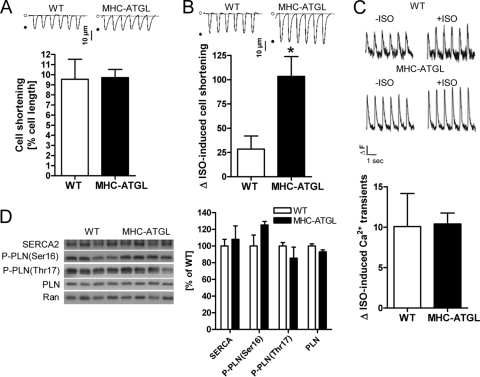
Fig 3.
Analysis of cardiomyocyte shortening and calcium homeostasis. (A and B) Cell shortening of isolated cardiomyocytes from female mice (21 to 26 weeks old, n = 8 to 13 cardiomyocytes from 3 mice per genotype). Cell shortening in the absence of isoproterenol (A) and percent increase in cell shortening when comparing stimulation with 100 nmol/liter isoproterenol to incubation without isoproterenol (B) (*, P < 0.05); insets show representative tracings of cell shortening. (C) Percent increase in calcium transients when comparing stimulation with 100 nmol/liter isoproterenol (+ISO) to incubation without isoproterenol (−ISO) (n = 7 or 8 cardiomyocytes from 2 female mice per genotype, 36 to 41 weeks old); insets show representative calcium tracings (ΔF, change in fluorescence intensity). (D) Immunoblots and densitometric analysis showing protein expression of SERCA2 and phospholamban (PLN) as well as phospholamban phosphorylation (P-PLN; ratio of phosphorylated PLN to total PLN) in hearts from male 4- to 5-h-fasted mice (35 to 36 weeks old). Ran GTPase served as the loading control.

