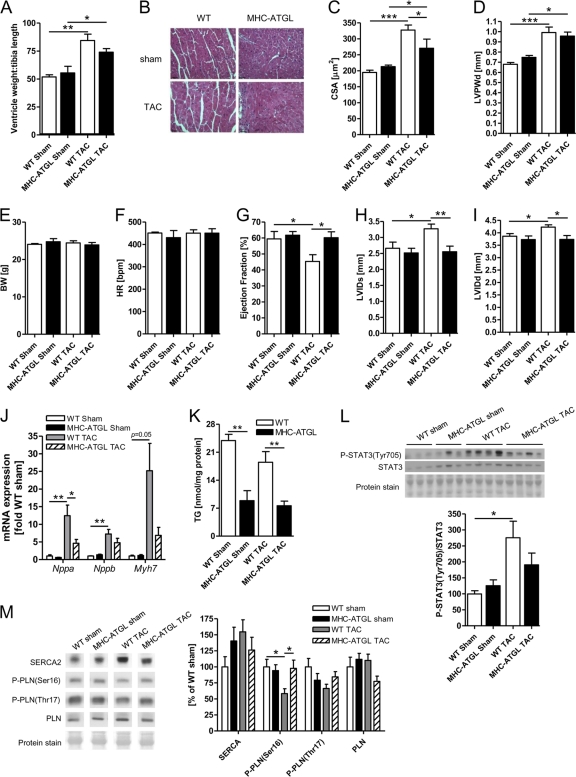
Fig 6.
In vivo heart function and cardiac morphometry following 5 weeks of TAC. (A) Ratio of ventricle weight to tibia length (n = 5 mice for sham, n = 6 to 10 mice for TAC; *, P < 0.05; **, P < 0.01). (B) Representative apical heart sections stained with hematoxylin and eosin visualized at ×400 magnification. Scale bars indicate 30 μm. (C) Cardiomyocyte cross-sectional area of 223 ± 9 myocytes from 4 to 6 mice per group was determined using hematoxylin- and eosin-stained heart sections (*, P < 0.05; ***, P < 0.001). (D) Left ventricular posterior wall thickness in diastole (LVPWd); (E) body weight; (F) heart rate; (G) ejection fraction; left ventricular internal diameter in systole (LVIDs) (H) and diastole (LVIDd) (I); (J) mRNA expression of hypertrophy marker genes; (K) myocardial TG content; (L) immunoblot analysis of STAT3 phosphorylation (ratio of phosphorylated STAT3 to total STAT3); (M) immunoblot analysis of SERCA2 and phospholamban (PLN) protein expression and PLN phosphorylation (ratio of phosphorylated PLN to total PLN) (n = 5 mice for sham, n = 6 to 10 mice for TAC; *, P < 0.05; **, P < 0.01; ***, P < 0.001).

