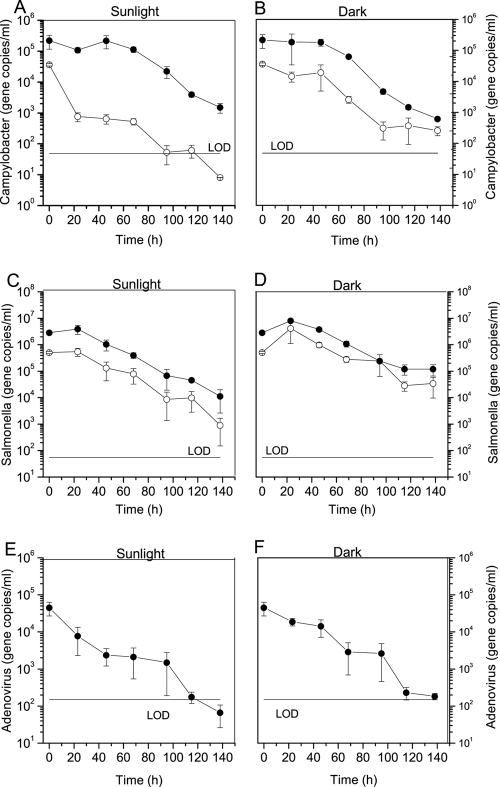
Fig 5.
Survival of waterborne pathogens in freshwater measured by PMA-qPCR or qPCR in freshwater. n = 3 for each mean; error bar represents standard deviation. (A to D) The concentration of Campylobacter jejuni under sunlight exposure (A) and dark conditions (B) and Salmonella Typhimurium under sunlight exposure (C) and dark conditions (D). Open and closed circles denote target concentration (gene copies/ml) measured by PMA-qPCR and qPCR, respectively. (E and F) The decay of adenovirus DNA under sunlight exposure (E) and dark conditions (F). LOD, limit of detection.

