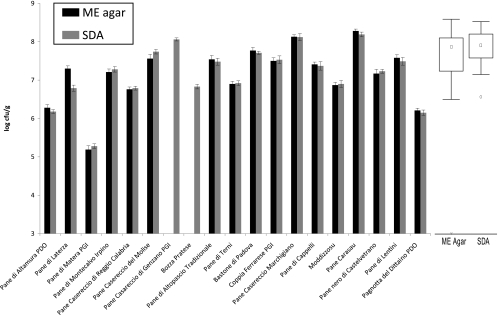
Fig 2.
Histogram and box plot representations of cell density (log CFU g−1) of yeasts in sourdoughs used for the manufacture of traditional/typical Italian breads. The center line of each box represents the median (□), and the top and bottom of the box represent the 75th and 25th percentiles of the data, respectively. The top and bottom of the error bars represent the 5th and 95th percentiles of the data, respectively. A circle in a box plot shows an outlier in the data (○), and a very extreme point is represented as an individual data point (*). Plate counts were carried out on different agar media: malt extract (ME) and Sabouraud dextrose (SDA). Data are the means of three independent experiments ± standard deviations, performed in duplicate (n = 6). Sourdoughs are indicated with the names of the related breads.

