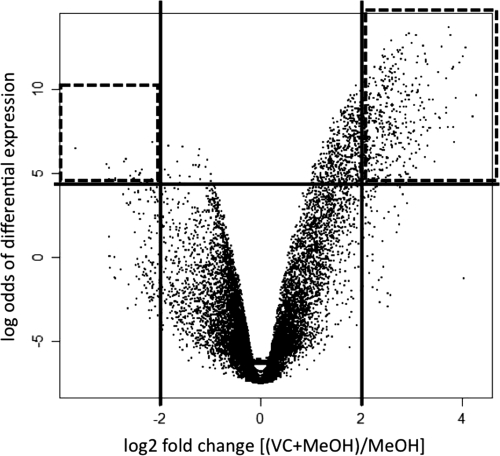
Fig 2.
Volcano plot indicating spots with differential intensity values. The x axis shows values for all spots averaged over the six arrays. A value of 2 indicates that the spot had 4 times the intensity in the VC treatment. The y axis is the B statistic, where 4.6 corresponds to a 99% likelihood that the spot exhibits differential intensity levels. Spots in the upper left and upper right quadrants were chosen as the statistically significant spots to be sequenced.

