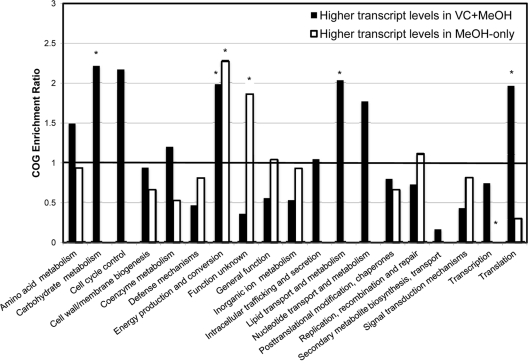
Fig 3.
Representation of clusters of orthologous group (COG) categories in Dehalococcoides genes exhibiting different transcript levels between treatments. On the x axis are COGs as defined by the eggNOG database. On the y axis is an enrichment ratio representing the relative proportion of each COG category in the sequenced spots compared to the average COG abundance in Dehalococcoides genomes according to the equation enrichment ratio = proportion of COG X in Dehalococoides sequences with higher transcript levels/proportion of COG X in Dehalococcoides genomes. A ratio of 1 indicates that there is the same proportion of that COG in the sequenced spots as in an average Dehalococcoides genome. COGs which have statistically significant enrichment ratios are marked with an asterisk. P values were calculated using a hypergeometric distribution.

