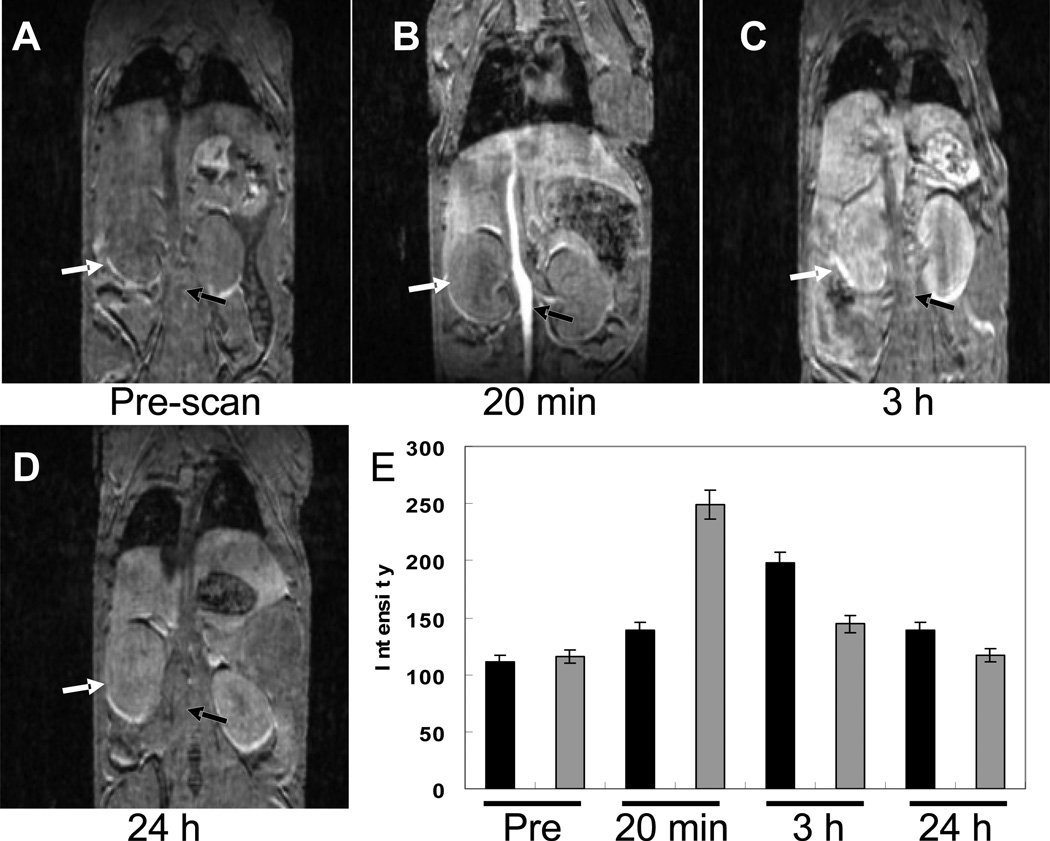
Fig. 4.
MR images of ProCA1 injected mouse scanned on 4.7 T at different time points using 3D-gradient echo sequence. (A) Pre-scan without injection of ProCA1. (B) MR image scanned after 20 minutes injection of ProCA1. (C). MR image scanned after 3 h injection of ProCA1. Arrows indicate the enhancement of artery and kidney. (D) MR image scanned after 24 h injection of ProCA1. (E) Comparison of MR image intensities of the kidney (black) and artery (grey) as a function of time before and after injection of ProCA1.

