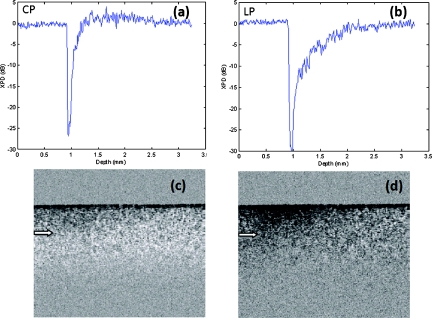
Figure 3.
Dentin tissue images from the sectioned side of a normal human tooth. XPD ratio in Eq. 1 is used as the mapping algorithm. The averaged XPD curves for CP and LP configurations are shown in (a) and (b), respectively. They are similar to the XPD curves of large microsphere phantom. Two-dimensional images of (c) CP and (d) LP have similar textural patterns arising from speckle noise. But, the CP image shows a more whitish band below the surface compared to LP images which indicates XPD > 0 due to PME. Image size is 3.2×2.6 mm (H×W) in air.

