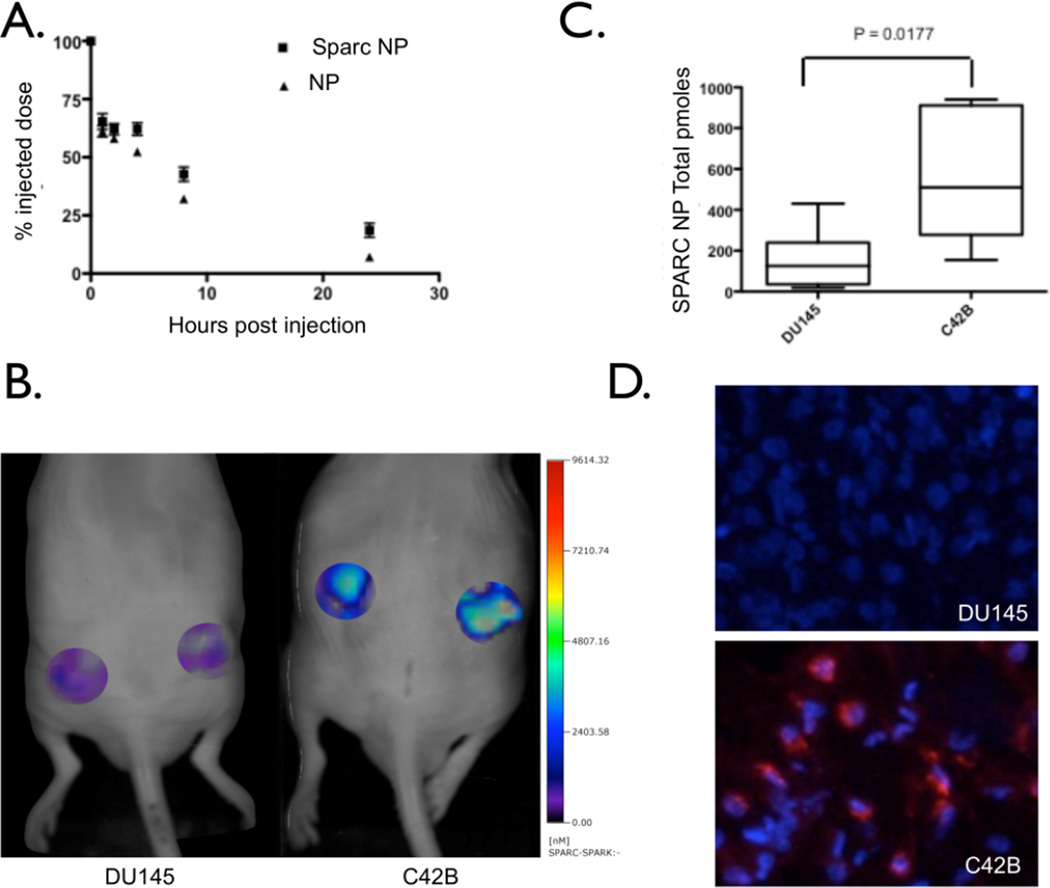
Figure 3. In vivo characterization and imaging.
A. Blood ½ life studies with both SPARC NP and base NP. B. FMT imaging of DU145 (left) or C42b (right) subcutaneous prostate tumors. C. Quantitation of SPARC NP accumulation and binding in the DU145 or C42b tumors. D. Correlative fluorescence microscopy of either DU145 or C42b tumors. Blue – DAPI nuclear stain, Red – SPARC NP.

