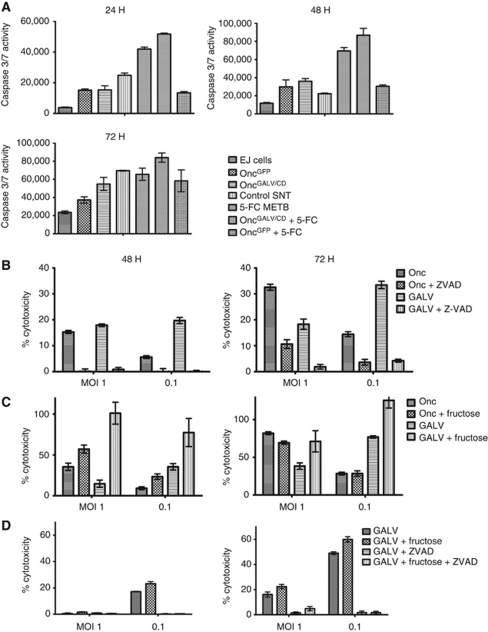
Figure 4.
Bladder TCC cells follow apoptotic pathway after infection with OncovexGALV/CD. (A) EJ cells were infected with OncovexGFP or OncovexGALV/CD (MOI 1) with or without 5-FC (600 μM) or its metabolites for 24, 48, and 72 h. Caspase activity was detected using Caspase Glo 3/7 reagent (Promega). Unpaired student t-test comparing GFP vs GALV/CD P-value 24 h 0.8919 48 h 0.2596 72 h 0.061. (B) EJ cells were infected OncovexGALV/CD or OncovexGFP at MOIs of 1, 0.1 and then incubated with and without 50 uM Z-VAD-FMK (Sigma) for 48/72 h. After which, the supernatant of the samples were assayed for lactate dehydrogenase activity (LDH) a marker of cytotoxic cell death (Roche). (C) EJ cells were infected with OncovexGALV/CD or OncovexGFP at MOIs of 1, 0.1 and then incubated with and without 20 mM fructose and incubated for 48/72 h at 37 °C. LDH assays were carried out on sample supernatant. (D) EJ cells were infected with OncovexGALV/CD at MOIs of 1, 0.1 and then incubated with either 50 μM Z-VAD-FMK or 20 mM fructose or both and incubated/assayed as above (unpaired student t-test comparing P-value Onc vs Onc ZVAD, 48 h MOI 1 P>0.0000, MOI 0.1 P 0.0127, 72 h MOI 1 P>0.0000, MOI 0.1 P 0.000. GALV vs GALV ZVAD 48 h MOI 1 P>0.0000, MOI 0.1 P>0.0000, 72 h MOI 1 P>0.0001, MOI 0.1 P>0.0000. Onc vs Onc Fru, 48 h MOI 1 P0.0078, MOI 0.1 P 0.0032, 72 h MOI 1 0.0051, MOI 0.1 0.3229, GALV vs GALV Fru 48 h MOI 1 P>0.0015, MOI 0.1 P>0.0001, 72 h MOI 1 0.0595, MOI 0.1 0.0148).

